Introduction to loon.shiny
Zehao Xu
2022-10-08
introduction.RmdOverview of the three packages
library(loon.shiny)
Shiny
The shiny
R package simplifies the creation of interactive analysis
web pages.
A shiny application is composed of two components, a
ui (user interface) and a server function.
This ui/server pair are passed as arguments to
the shinyApp function that creates a shiny
app. The ui (user interface) creates the layout of the app,
guiding its users about the analysis by determining the objects that
appear and how they can be manipulated on such application. The
server function reacts to modifications on the
ui, defining the logic of the app. As the user interacts
with the page, the server function reacts to make changes
in the display.
Loon
The loon
R package provides an interactive visualization toolkit for
unconstrained, unscripted, and open-ended data exploration. It is
intended for data analysts themselves.
An important part of loon’s interactivity is the
loon inspector which can can make changes specialized
to different loon plots. Typically, the loon
inspector has a single instance. The inspector will adapt its display to
whichever of the different base loon graphics
(scatterplots, graphs, histograms, serial axe plots, etc) is its focus
(e.g., the graphic display that last received a mouse or window focus
event.
For loon users, it is a challenge to provide a
curated analysis that is still somewhat interactive. Snapshots
of different steps of the analysis are easily accommodated via
RMarkdown, etc. but interaction is not.
Loon.shiny
Loon.shiny transforms loon widgets to
appear (with their inspector) in a shiny web app.
loonhas a powerful inspector involving almost many of the components considered essential for interaction on each graphic. Withloon.shiny, this powerful interface can be inserted into ashinyapp to provide a multitude of interactions at once.loon.shinyprovides analysts who explore data inloonthe ability to incorporate selected interactive components of that analysis inRmarkdown. In addition to extending the possibilities for reproducible research, this can further empower the viewer of that research to explore other possibilities within the document itself.
The idea behind the implementation: In
loon.shiny, loon widgets are transformed to
static loonGrobs created by the R base
grid package to provide low-level, general purpose graphics
functions. Note that, a loonGrob contains all elements of a
loon plot even some not drawn contents, i.e. deactivated
elements, hidden layers. All these essential contents are stored inside
an empty grob possessing the argument values necessary to
draw them. When the server function is fired, the
interactivity is realized by editing and redisplaying these
loonGrobs.
Basic Usage
Consider the classic iris data set.
library(loon.shiny)
library(dplyr)
library(magrittr)
# Loon scatterplot
p <- with(iris,
  l_plot(x = Petal.Width,
         y = Sepal.Width,
         color = Species)
)
# Modify glyph to radial axes glyph.
p['glyph'] <- l_glyph_add_serialaxes(p, data = iris)
# Fit a linear regression on each group (species)
for(s in unique(iris$Species)) {
  # sub data set
  subdata <- iris %>%
    filter(Species == s)
  # fitted line
  fit <- lm(Sepal.Width ~ Petal.Width, data = subdata)
  x <- subdata$Petal.Width
  pred <- predict(fit, interval = "confidence")
  ord <- order(x)
  # Loon pipe model (connected with %T>%)
  # Check ```help(`%T>%`)``` for more details
  p <- p %T>%
    # fitted line
    l_layer_line(x = x[ord],
                 y = pred[, "fit"][ord],
                 color = "firebrick",
                 linewidth = 1.5,
                 index = "end") %T>%
    # confidence interval
    l_layer_line(x = c(x[ord], rev(x[ord]), x[ord][1]),
                 y = c(pred[, "lwr"][ord], rev(pred[, "upr"][ord]), pred[, "lwr"][ord][1]),
                 color = "grey50",
                 linewidth = 2,
                 index = "end")
}
loon.shiny(p, plotRegionWidth = "400px")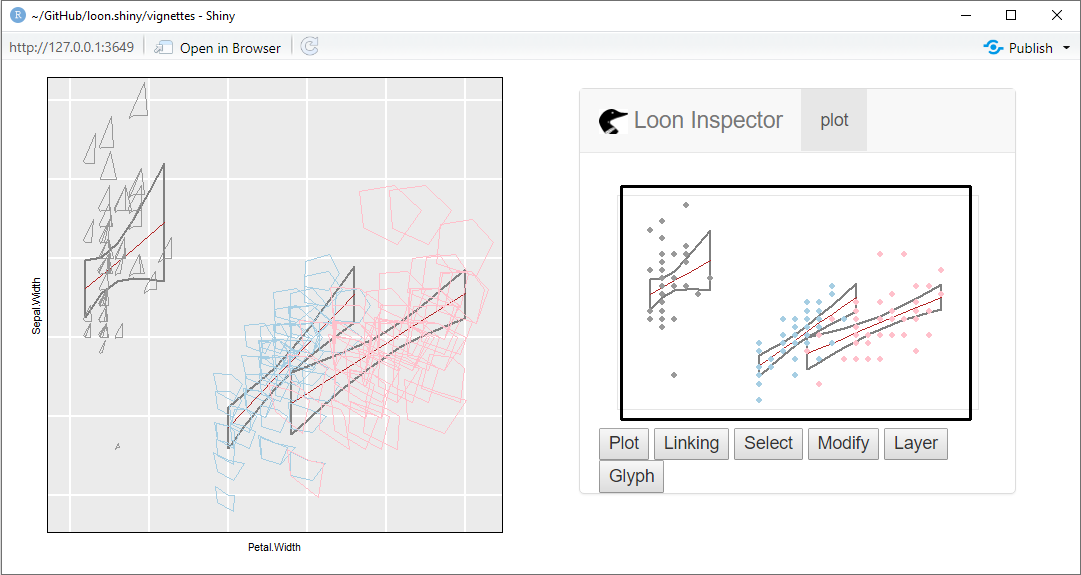
The left panel is a scatterplot which receives mouse can be utilized
for direct manipulations. The right panel is an inspector, mainly for
indirect manipulations. Compared with the loon one, it is
different that is composed of a world view window and six buttons
(Plot, Linking, Select,
Modify, Layer and Glyph). Each
channel will be popped up by pressing the corresponding button. Due to
very limited layout space, such design can make the inspector look
fresh.
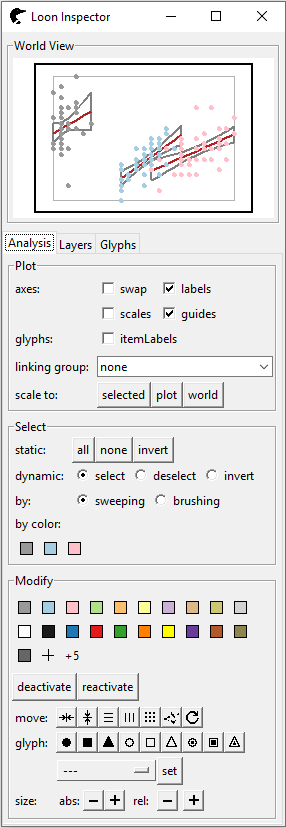
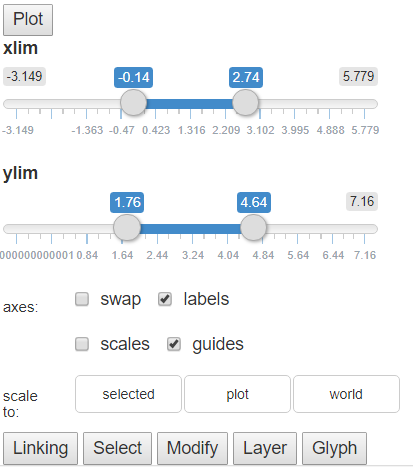
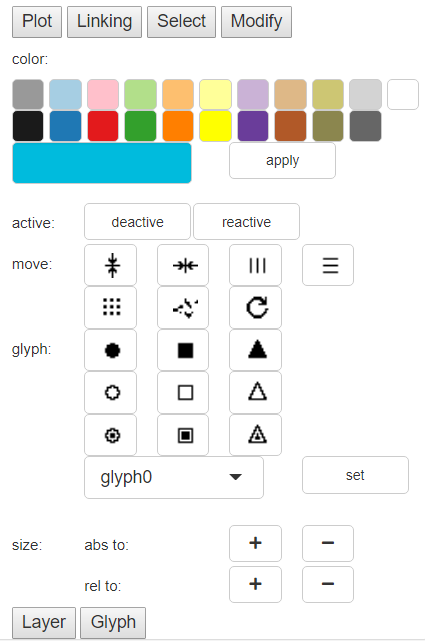
-
Plotpanel:Zooming and Panning: In
loon, they both are realized by direct manipulation with cooperation of mouse and modifier keys<shift>. While, inshiny, functionplotOutput()cannot trace right click and scrolling yet. Hence, we build two slider bars to controlxandylimits.Axes: channel
axesis a central control of non-data elements display, such as turning on/off labels, scales and guides or flipping the horizontal and vertical axes.Scale to: channel
scale tore-scales the plot interior to some range: range ofselectedpoints, range of all points in theplotand range of all plots objects in all layers (world).
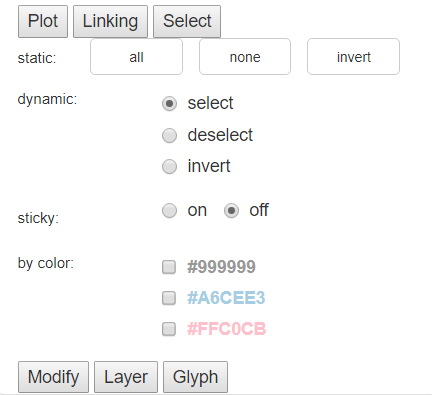
Linkingpanel: since we only have one graph, no linking is required here. We will talk more about this in next section.-
Selectpanel: channelselectis mainly utilized to modify points selection. There are two main channels,staticanddynamic.For
static, there are three buttons,all,noneandinvertindicating to select all visible points, deselect all points and invert the current selection status respectively.-
For
dynamic, it is often used to switch the selection mode.select: the brushing box is used for highlighting pointsdeselect: any highlighted points fall into brushing box will be downlighted;invert: the status of points sweeped by brushing box will be inverted, highlighted to downlighted, downlighted to highlighted.
There are several noticeable difference here:
The
selectpanel inloon.shinydoes not involve abychannel. Inloon, users can select by eitherbrushingorsweeping. However, inshiny, the modebrushingorsweepingis pre-defined in functionplotOutput()and there is no way to update it. Once the app is rendered, the select mode is set and cannot be switched.Loon.shinyhas astickyradio box. It is the same with<shift>key inloon(the usage of<shift>key in loon can be found inloonvignette orloontalk). This is becauseshinydoes not include trace functions to record key press so far.by colorchannel is replaced by check box inshiny, sinceshinydoes not include functions to automatically generate new buttons inserverfunction. However, such changes give an unexpected benefit, color names can be detected easily.
-
Modifypanel: Except the layout,modifypanel largely restores the design of theloon.Color:colorbuttons are used to modify element colors and the color picker widget provides users more choice.Activate:activatehelps to deactivate or reactivate elements.Deactivatebuttons turn selected objects invisible andreactivatebuttons reactivate all deactivated points.Move:Moveselected points to common horizontal position, to vertical position, and etc (seeloontalk for more details).Glyph: Change the shape of the points.Size: Decrease or increase point size.
-
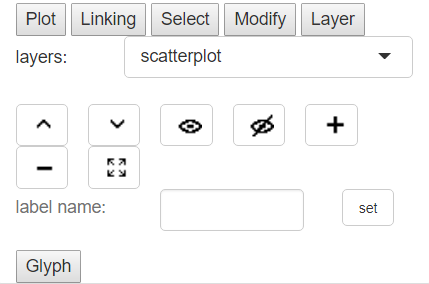
Layerpanel: this panel a simplified version ofloonlayer tab. The top select box indicates which layer is under activation and the buttons below are used to, move layer up or down a level, make layer visible or invisible, add layer group (deprecated now), delete layer and scale plot region to layer. The last command is to customize the layer label.
-
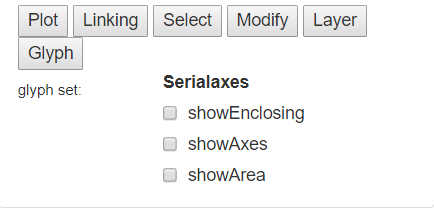
Glyphpanel: it is to modify the appearance of glyphs. Note that different glyphs have very different glyph settings. For example, the settings of serial axes glyphs include whether to show enclosing box, display axes labels and fill the glyph region.
Compound Plots
Arbitrarily many plots may be created and linked in
loon. Package loon.shiny successfully inherits
such facility.
Following graph illustrates compound plots. The three graphs are
histogram of variable Sepal.Length, scatterplot of
Sepal.Width versus Sepal.Length and swapped
histogram of variable Sepal.Width (from top to bottom, from
left to right). They are colored by species and linked each other.
p1 <- l_plot(iris, linkingGroup = "iris",
             showLabels = FALSE)
p2 <- l_hist(iris$Sepal.Length, linkingGroup = "iris",
             showLabels = FALSE,
             showStackedColors = TRUE)
p3 <- l_hist(iris$Sepal.Width, color = iris$Species,
             linkingGroup = "iris",
             showLabels = FALSE,  swapAxes = TRUE,
             showStackedColors = TRUE)
loon.shiny(list(p1, p2, p3),
           layout_matrix = matrix(c(2,NA,1,3), nrow = 2, byrow = TRUE),
           plotRegionWidth = "400px")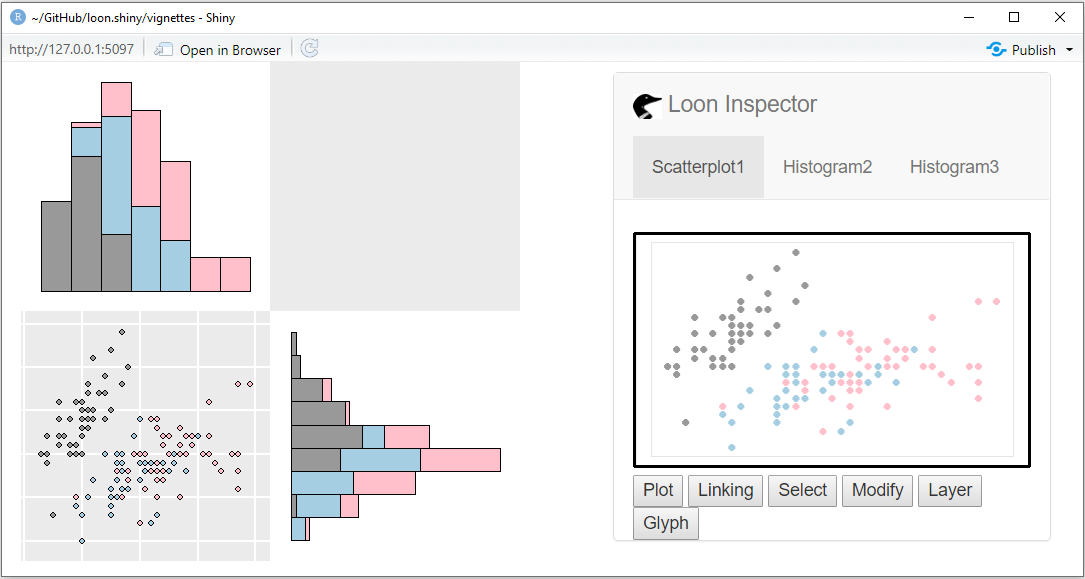
Inspector Activation
Loon inspector is a singleton which means there is only
one instance of it. Each kind of graphics (scatterplots, graphs,
histograms, serial axes plots, etc) has its own specified inspector. The
shown one depends on which display receives the last mouse gesture input
or window focus event. However, such design in shiny can be
very complex. Instead, we build a navigation bar menu. The inspector can
be switched by toggling tabpanel on the bar menu or the
last mouse gesture (<double click>)
input.
Linking
If we brush on any of these plots, the corresponding elements on the
rest will be highlighted instantaneously. Linking status can be checked
via linking panel.
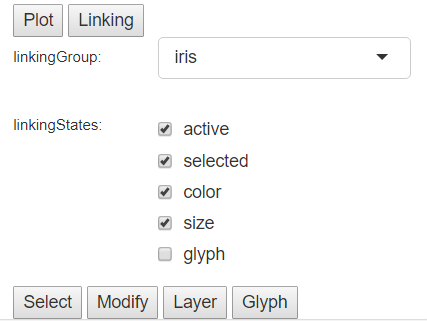
The principal feature of
loonplots which effect the linking of displays is the setting of a commonlinkingGroup.LinkingGroupis used to identify which group this plot joins. If it is set as “none”, then this plot will not be linked with any of them.LinkingStatesare states to be linked in the samelinkingGroup. Unlikeloon, programming is forbidden once the app is rendered. Thus, we list all the states can be modified in thelinkingpanel. All elements in these three pictures share the same selected/checked states. Suppose one un-checks theselectedcheck box in scatterplotlinkingpanel, and then brushes the points on scatterplot, the corresponding elements in other two histograms will not be highlighted anymore.